Visualizing physical quantities from adaptive grids with yt
As described in Extracting physical quantities, it is easy to extract quantities such as density, specific_energy, and temperature from the output model files. In this tutorial, we see how to visualize this information efficiently for AMR and Octree grids.
Fortunately, we can just make use of the excellent yt package that has been developed for that purpose! Hyperion includes convenience methods to convert grid objects to objects that you can use in yt.
If you extract quantities from an output file with:
grid = m.get_quantities()
then grid will be an AMRGrid or OctreeGrid grid object. This object contains all the information about the grid geometry, as well as the physical quantities such as density, temperature, and specific energy (depending on how you configured the model). You can then simply do:
pf = grid.to_yt()
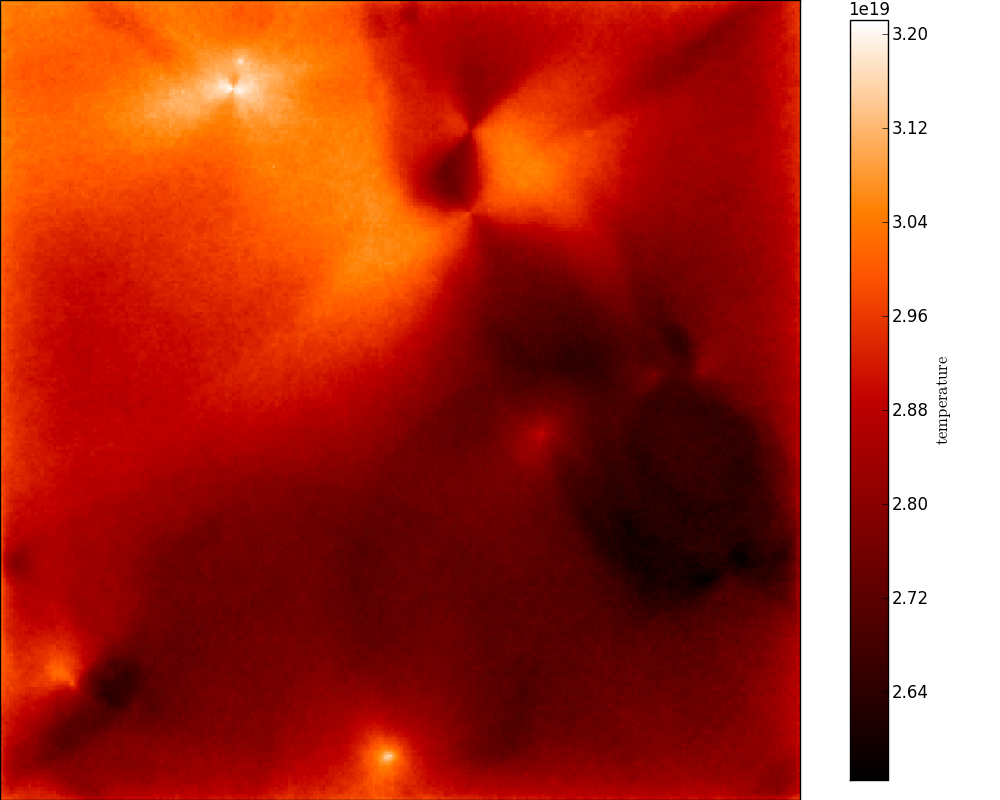
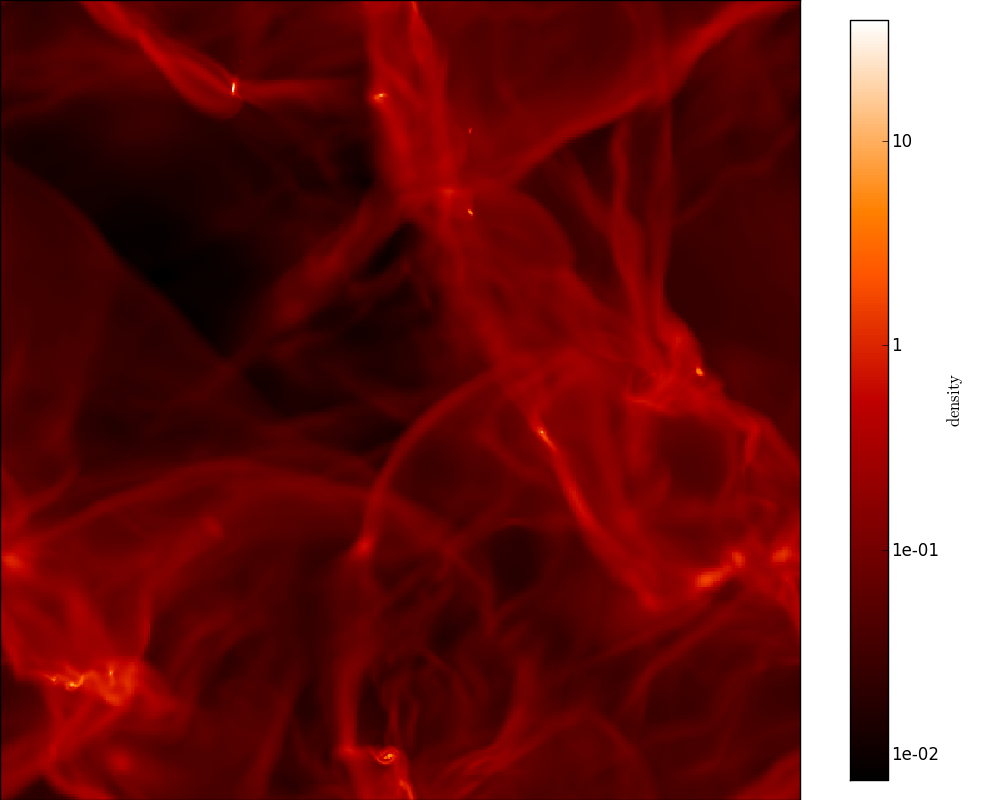
where pf is a StaticOutput yt object! This can then be used as a normal dataset in yt. For example, we can easily make projections of density and temperature along the y-axis:
from yt.mods import ProjectionPlot

prj = ProjectionPlot(pf, 'y', ['density', 'temperature'],
                     center=[0.0, 0.0, 0.0])
prj.set_cmap('temperature', 'gist_heat')
prj.set_cmap('density', 'gist_heat')
prj.set_log('density', True)
prj.save()
The to_yt method is also available for regular cartesian grids, but not for the spherical or cylindrical polar grids.
Note
At the moment, the method used to plot Octrees is very inefficient, so plotting these will be very slow.
Projection plots are just a very small fraction of the functionality of yt - you should have a careful look at their documentation to find out about all the available functionality!
If we apply this to the output for the radiative transfer model on the hydrodynamical simulation in Robitaille (2011), the density looks like:
and the temperature looks like: